Visualization and Online Experiments
 Mathematical
visualization has proven to be an efficient tool for analyzing complex mathematical
phenomena, and it has given decisive hints leading to rigorous mathematical proofs of
long-standing problems. Visualization is not only a tool to visualize complex objects but
in combination with modern numerical methods allows to perform mathematical experiments
and simulations in an artificially clean environment. For example, the unveiling of the
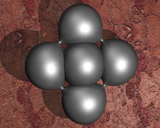
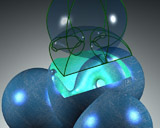
Costa-Hoffman-Meeks surface [6] (figures Unveiling the Costa Formulas and Costa-Hoffman-Meeks Minimal Surface), or the first
numerical examples of compact constant mean curvature surfaces with genus greater than two
[5] (figures besides) are among the most prominent
results of the fruitful interaction of mathematics with the new toolkit mathematical
visualization.
Mathematical
visualization has proven to be an efficient tool for analyzing complex mathematical
phenomena, and it has given decisive hints leading to rigorous mathematical proofs of
long-standing problems. Visualization is not only a tool to visualize complex objects but
in combination with modern numerical methods allows to perform mathematical experiments
and simulations in an artificially clean environment. For example, the unveiling of the
Costa-Hoffman-Meeks surface [6] (figures Unveiling the Costa Formulas and Costa-Hoffman-Meeks Minimal Surface), or the first
numerical examples of compact constant mean curvature surfaces with genus greater than two
[5] (figures besides) are among the most prominent
results of the fruitful interaction of mathematics with the new toolkit mathematical
visualization.
Mathematical experiments require the following goals to be accepted in
the mathematical community similar as experiments in physics and chemistry:
- Validation of experimental data by independent groups
- Publication and storage of experimental results and data sets
- Cooperation of researchers on the same experiment while sitting at different places
Up to now visualization has required high-end workstations combined
with mainframe computers for numerical computations. Each research lab had developed own
software dedicated to specific graphics hardware. The specialization of the software for a
specific visualization task or numerical problem as well as the dependence on a specific
hardware platform had major drawbacks for the scientific communication. The major reason
for the current non-fulfillment of the goals 1. and 2. is a missing world-wide standard
and interface for the different software packages, and for goal 3. the missing standard to
exchange data sets between experimental software packages and research publications.
Currently research publications are paper-based where there is no way back from written
publications to digital data sets. Even worse, in order to fit into a restricted page
layout and fulfilling the allowed number of pages, publications cannot include all data
but restrict to the so-called 'most relevant data'. The presentation of experimental
results in publications are incomplete and often moved to the appendix so that it is
usually not possible to validate or reproduce them.
In order to allow validation of experiments and of numerical data sets
it is essential to allow direct public access to the data in an electronic format in the
same way as public access to research publications is given through libraries. This joint
publication of experimental and numerical data requires to insist on the similar
principles known from the publication of scientific research results:
- Unambiguous, self-contained digital representation of the data, i.e. no dependence on
existing software packages.
- Reviewing of data sets, e.g. to ensure technical correctness and scientific relevance.
- Indexing data sets to allow unique references, e.g. when data is used in other
experiments.
In the following sections we discuss how online visualization might
look like and about the possible difficulties to encounter.